Geological anomalies using Geophysical Method
1.0 Introduction:
SandVik Mining & Construction Ghana Limited client, has proposed the construction
facilities including workshops, training centres offices etc. at their proposed site
around Pakyi No1 in the Ashanti Region.
Atelier Ghana Limited, the project architect acting on behalf of the client, engaged
Hydrolog Geoinformatics limited to conduct geotechnical investigations at the site.
The geotechnical investigations include conducting surface geophysical survey to
delineate any geological anomalies such as fault zones.
Electrical resistivity ground geophysical survey which is commonly used for
geotechnical investigations and environmental surveys, due to its efficiency and
effectiveness in producing images of the subsurface was carried out at the site.
The overall goal of the electrical resistivity survey at the proposed site was to obtain
the geological structure of the upper most 30m of the subsurface in the lateral and
vertical extent.
This report discusses the survey procedures and interpretation of electrical resistivity
survey carried out at the proposed site for SandVik Mining & Construction Ghana.
2.0 Survey Procedures:
2.1 Equipment:
1. WERI Series Multi electrode resistivity measuring system (Figure1). This consists of:
a) W-3 Series Resistivity/IP Meter (Main frame)
b) WES 60 Electrode Switcher Unit
c) Intelligent multicore cable
d) Steel Electrodes

2.2 Field Measurements:
Two main field measurements were carried out at the site, which are profiling and
vertical electrical sounding techniques.
Electrical resistivity profiling survey was conducted along three (3) selected traverses
(Line1, Line2 & Line3) (Figure 2) in a regular grid at 30m interval to determine the
lateral variation of geological anomalies. The maximum length of the measured
profile was 300m with unit electrode spacing of 5m. The Schlumberger electrode
array sounding technique was also conducted at four borehole locations (BH1, BH3,
BH5 &BH7) to also determine vertical variation in resistivity anomalies, such as
groundwater that may affect foundation excavations.
3.0 Discussion of Results:
Processing and analysis of geophysical data and interpretations were carried out using
EarthImager2D inversion and IX1D software for profiling and sounding resistivity
data respectively.
The sequence of processing of each profile data using EarthImager2D inversion
software shows the inversion results after 3 iterations with RMS errors (11.2-23.9 %),
and L2-norm of (1-10), which are considered the optimum model for interpretation
and convergence of inversion.
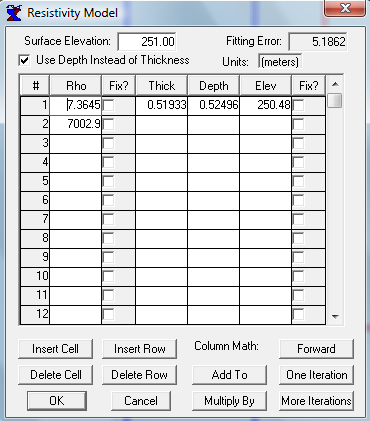
Again, the processing of each vertical electrical sounding data with IX1D software
also shows the inversion results after multiple iterations inversion with a fitting error
less than 10% are also regarded as the optimum model for interpretation.
WDJD-3 Multifunction digital DC Resistivity/IP meter was used to conduct Vertical
Electrical Sounding (VES) to determine vertical resistivity anomaly for groundwater
beyond the depth of geotechnical exploratory borehole. This instrument enables
measuring the potential current ration which multiplies with the geometric factor, k, to
give the apparent resistivity values in Ohm-m. The Schlumberger 4-electrode array
configuration was used in conducting the sounding measurements with current
electrode spacing (AB) =60m at each sounding station. The VES models are
represented in the form of resistivity sounding curve, relating the apparent resistivity (ρa) to half of the current electrode spacing AB/2 (depth). Four (4) VES soundings
were carried out at four borehole locations (BH1, BH3, BH5 &BH7) at the site.

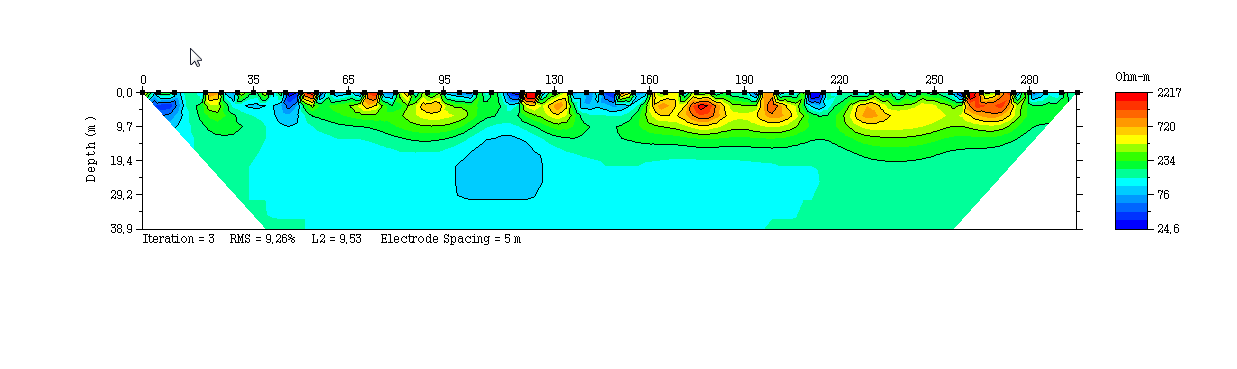
3.1 Interpretation of 2D Inversion Data:
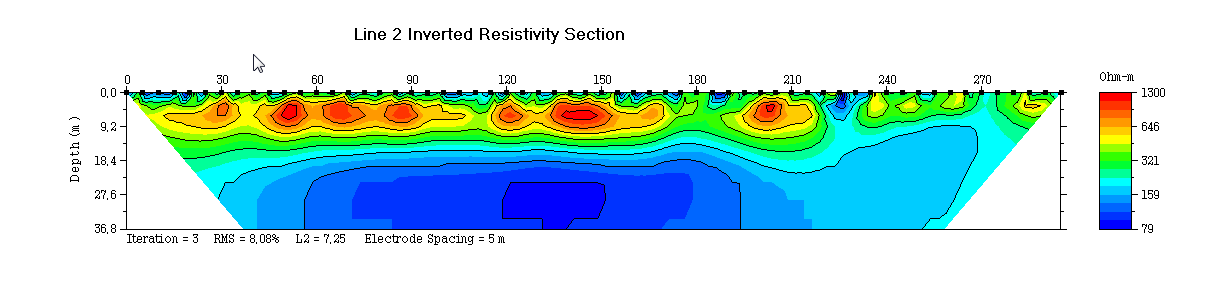
Pseudosection resistivity results (figures 3, 4 & 5) give a pictorial representation of
geological anomaly in the subsurface. These profile images (pseoudosections) of the
subsurface were obtained through the inversion of measured apparent resistivity
profile data. The results from the profiling pseudosection did not detect any
geological anomaly such faulting within the site. However, it did provide a clear
indication of moisture content variation laterally.
The inverted pseudosections show three resistivity zones within the first 10m from the
top of the image along the traverse.
These are:
1. Low resistivity zones with resistivity range between 24.6 to 100 Ohm-m (deep
blue to light blue to cyan shading). These low resistivity zones are interpreted
as soil material with relatively high moisture content.
2. Moderate resistivity zones with resistivity range between 100 to 750 Ohm-m
(green to light orange shading). This moderate resistivity zones are interpreted
as soil materials with moderate moisture content.
3. High resistivity zones with resistivity range between 750 to 2217 Ohm-m
(dark orange to red shading). These are interpreted as slightly weathered
material or air field voids with less moisture content.

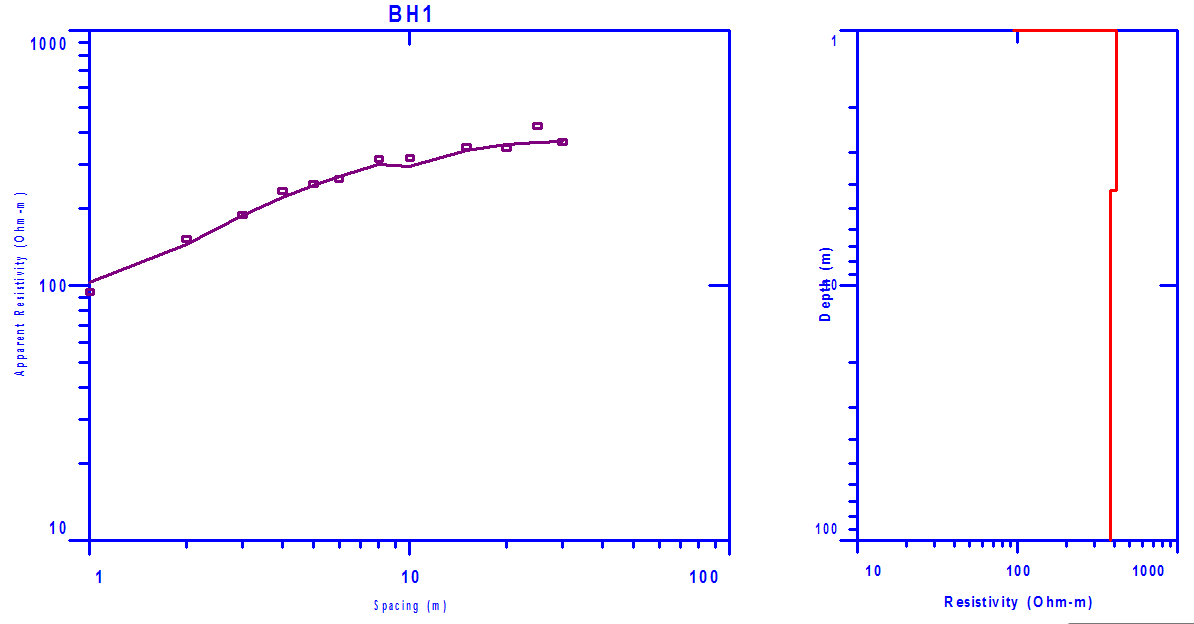
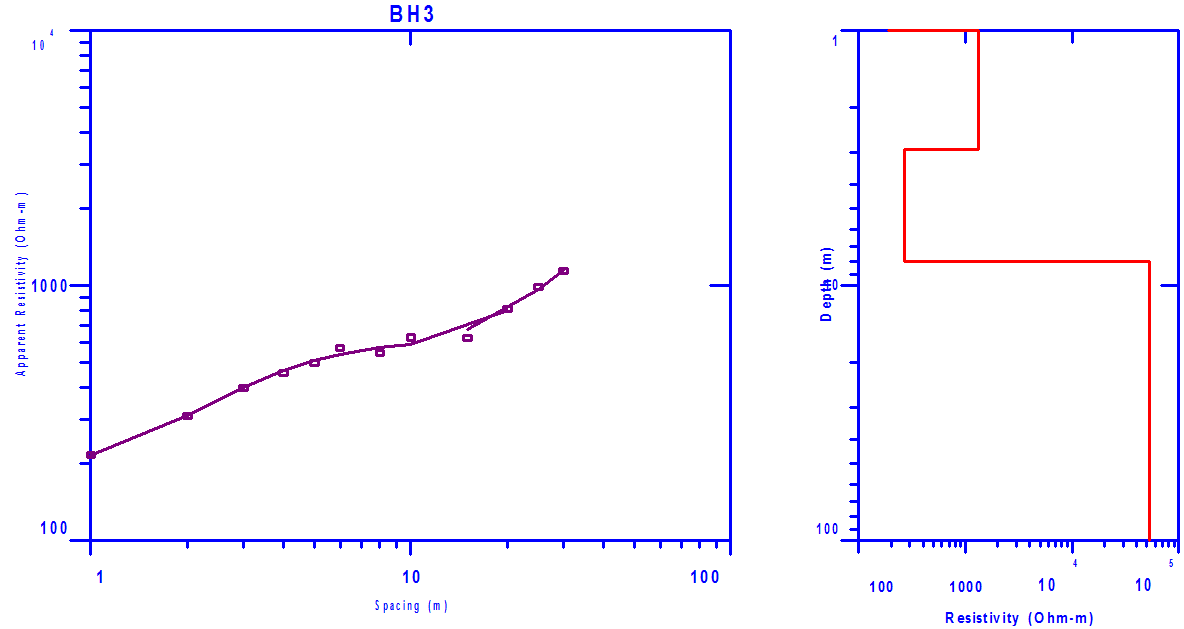
3.2 Interpretation of 1D Vertical Electrical Sounding (VES) Resistivity Data:
The results from vertical electrical soundings for BH1, BH3, BH5 and BH7 are
presented in (figures 6a, 6b, 7a, 7b, 8a, 8b, 9a & 9b). The layering parameters
(resistivity ρ, thickness h and depth) can be obtained from the apparent resistivity
data. The interpretation of each VES curve was carried out through the use of
automatic interpretation computer software “Interpex 1-D Sounding Inversion
Version 3.45” software written by Interpex Limited (2008). The accuracy of the
inverse model was improved by using standard methods of data collection followed
by moving abhorrent data points from the field curves before computing the inverse
model. Finally, a careful consideration of available geologic information was taken
into account for each inverse model. The interpreted layer parameters of the subsurface layers for each VES station are illustrated in the figures below. The
correlation of the geoelectrical parameters (resistivity, thickness and depth) of the
resulting layers with the geological succession from boreholes led to the identification
of three layers. The succession can be established as follows:
1. The first layer has soil materials resistivity values ranging between 7.36Ohmm
to 188.26Ohm-m; and with varying thickness values from 0.52m to 0.96m.
2. These second layer also has material with resistivity values ranging from
401.87Ohm-m to 7002.9Ohm-m.; and with varying thickness values from
1.98m to 3.6m.
3. The third layer has resistivity values ranging from 279.28Ohm-m to
402.69Ohm-m; and with varying thickness values from 5.3m to 30m.
VES soundings did not detect any ground regime within 30m meter depth from the
surface, and hence groundwater is not expected within foundation excavations within
this depth.