
How to predict landslides in Ooty region
ABSTRACT
The aim of the study is to identify the landslide prone zone in Ooty region, Tamilnadu, India. WERI Series is the Multi Function Digital DC Resistivity IP/Meter ,latest all-purpose model for Multi-Electrode Resistivity Imaging System equipped with the latest technologies. It features multiple functions, high accuracy, fast speed, high reliability and excellent expandability. It can function General resistivity /IP Sounding and Multi-Electrode 2D/3D resistivity imaging. The survey was carried out using WERI Series resistivity system with help of Wenner configuration. The aim of the survey is to identify the landslide prone zone .The study reveals that the investigation area is highly vulnerable to landslide which is evident from the from the low and high resistivity zone of the study area. The water body with loose sand is identified from low resistivity, highly weathered zone is indicate the charnockite and compact charnokite gives high resistivity zone in the study area..2D ERI technique helps to distinguish the water bearing weathered zone, lithomorgic clay and weathered gneissic rock. The elevation survey conducted using total station. The study area soil and rock mass sliding toe slides, rock mass sliding in the studyarea due to high rainfall and seismic activity. The case study focuses in the palaeoslides and with the related upcoming landslides in the study area. The resistivity image obtained from the Res2DINV software is used for the prediction of landslide in Ooty area.
Key Words: Landslide prediction, 2D ERI, Resistivity, Padukadu, Ooty
1. Introduciton
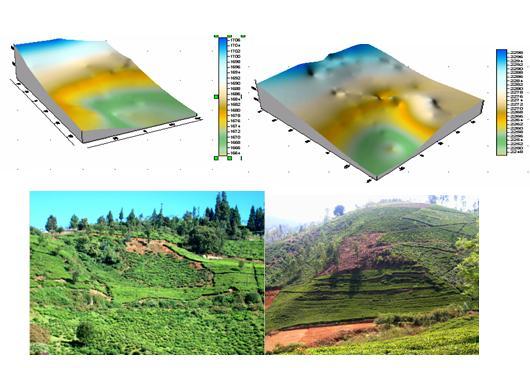
The aim of the study is focused on water bearing zone and weathered zone in the landslide prone zone in Ooty , Tamilnadu, India.. The study is carried out with five profiles in the study area. Ooty is formed in the high range of Western Ghats which is susceptible to landslides. This disaster may cause damage to life and properties of Ooty inhabitants. The Nilgiri Plateau is falling down to stream such as Bhavani, Moyar, Katteri, Connor, Kundah and Billithada halla respectively. The major landslide is happened in the stream path. The geologically formation of study area consist of Archean metamorphic rocks which include charnockite, biotite gneiss, laterite and lithomorgic clay. The tectonic activity was occurred in the Precambrian period. The Predominent lineaments identified are east-noth-east parallel to the river. The study area is Padukadu estate (N11º19’46.6”-E76º44’49.9”) Padukadu estate -Near sivankovil N11º19’54.2” - E76º44’56.0”,. The area is mainly composed of quartzites, bands of charnockites, garnetifereous biotite gneiss with enclaves of basic granulites and calc-granulites of Proterozoic age (Fig.1).

1.2 Data Acquisition
The collected data is processed using the Res2Dinv original software. The topographical corrections were carried out in the survey. This resistivity pseudo section is very effective tool to get more reliable information about the field. Topographic survey is carried out in the selected five landslide zones using total station. Due to the survey, Total station measures the angles (horizontal and vertical) and distances (horizontal distance and slope) from the instrument to reflected points. The collected data are prepared into topographic map of landslide zones with computer plotting with Surfer software and topographic corrections are implemented in final output of Pesudo-section.
1.3 Sliding mechanisms and soil slips in the study area.
There are slow movements of soil and other unconsolidated rock matters, down the slopes. These include creep, flow and slump. Excessively slow displacement of highly saturated soil is termed as Solifluction, which is characteristic of permafrost melts, the soil rich in water starts moving down the slope very gradually. Solifluction is an example of wet flow because it occurs in the presence of water (Fig.2) and (Fig.3).

2D Electrical Resistivity Imaging interpretation
2D electrical resistivity imaging study involves measuring a series of constant separation traverse with the increase of electrode spacing with each successive traverse. The increase of electrode spacing increases the depth of penetration, so that apparent resistivity measured at various depths is used to construct a vertical contoured section, displaying the variation of resistivities both laterally and vertically over the section, Antony Ravindran and Ramanujam,2012, Daily W (1992) et al , Edwards, L. S., 1977, Meidav T (1960), Loke, M.H. (1997),


The first profile (Fig.4) trends from NE -SW with a length of 140m and in 5m Electrode spacing intervals. The Elevation variation in pseudosection ranges from 1060m to 1100m. The Top layer constitutes Lateritic soil with resistivity ranges from 49.4 ohm m to 68.8 ohm m. The Intermediate layer of Weathered zone of Charnockite rocks with resistivity ranges from 128 ohm m to 902 ohm m .The bottom layer with resistivity ranges from 902 ohm m to 5010 ohm m, indicates the presence of Garnetiferous Charnockite.

In the second profile (Fig.5), the pseudosection denotes that the top layer is covered by Mud with highly weathered soil in a width of 125m and in depth of 10m, the resistivity ranges from 12 ohm m to 53.9 ohm m. The Intermediate layer of weathered zone with resistivity ranges from 73.9 ohm m to 112 ohm m .The hard and compact garnetiferous rock shows the high resistivity ranges from 235ohm m to 1040 ohm m.

In the Third profile (Fig.6) , the Elevation variation in pseudosection ranges from 1078m to 1058m .The Top layer constitute Lateritic soil with high saturation of water ,with resistivity ranges from 12 ohm m to 24.8 ohm m. The bottom layer with resistivity ranges from 25.2 ohm m to 106 ohm m, indicates the presence of Garnetiferous Charnockite .The thickness of this layer is 10m.

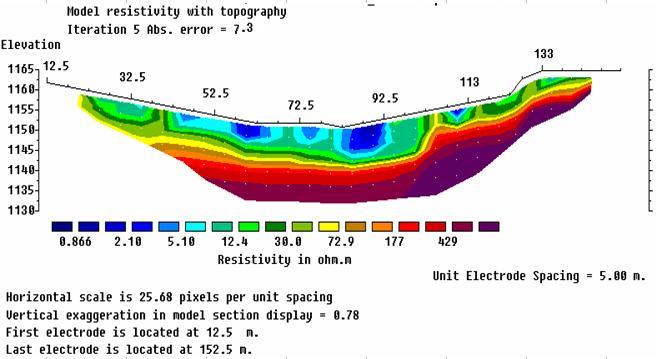
In the fourth profile (Fig.7), the pseudosection indicates that the top layer is covered by clay with resistivity ranges from 0.866 ohm m to 2.1 ohm m. The Intermediate layer of Weathered zone with resistivity ranges from 2.10 ohm m to 72 ohm m.
Conclusions
The 2D Electrical Resistivity Imaging technique is used to demarcate prediction of landslides in the study area. The Fluid flow mechanism and weathered zone of Charnockite Gneiss having the low resistivity values indicates the weak zone of study area .The Charnockite rocks, highly jointed are filled with water and to generate Lithomargic clay .The continuous Rainfall and huge amount of soil thickness in the slope are the causes for Landslides. The field study is carried out to differentiate the distribution of the resistivity values basis upon the clay,/soil with moisture and without moisture ;the red soil/laterite with moisture and without moisture and weathered profiles of substratum and fresh rocks. The profile Padukadu estate embody the lithomorgic clay with low resistivity that ranging from 5-50 Ohm.m. The basin like weathered gneiss rock formation ranges of resistivity from 283 to 50-100 Ohm.m in the study area. The present work is to investigate landslide prediction in Ooty, Niligiris hills which caused damage to people and property and to devise preventive and precautionary steps to be taken in the event of future landslides using the 2D Electrical Resistivity Imaging technique.