
How to detect water leakage in dam walls
Abstract :
Any unplanned leaks in dams may lead to the failure of the dams or other environmental hazards threatening human beings, animals and birds such as surface water and groundwater pollution, the pollution caused by substances capable of oxidation and dissolution, etc. Geophysical methods due to their non-destructive character is more successful in environmental studies. To Identify and characterize the possible leakage from the Miduk copper mine tailings impoundment, the electrical resistivity tomography (ERT) and self-potential (SP) methods was used. ERT is related to changes in subsurface electrical conductivity. Both electro-kinetic and electrochemical potential lead to self-potential, that occurs from hydraulic head difference and changes in ion concentration, respectively. In north abutment of dam, the results of electrical resistivity survey show a zone with resistivity values less than 15 ohm-meter in depth of approximately 8 meters. Also, SP measurements show positive anomaly in this area. So, this abutment has leak.
Keywords:
Tailing Dam, leakage, Electrical Resistivity Tomography, Self-Potential
Introduction:
Mining, like other industrial activities, can have a negative impact on the environment. Sewage dams cause major negative effects. Some aspects, such as geotechnical, physical, and chemical instability, can lead to events with very negative effects on the environment. In fact, tailings dams(A tailings dam is typically an earth-fill embankment dam used to store byproducts of mining operations after separating the ore from the gangue) are more vulnerable than other structures in the mine, and due to their unstable nature, location, which is often close to sensitive ecosystems, and lack of necessary maintenance, especially after the end of the mine life, is a significant threat. Significant losses and damages have occurred as a result of the entry of large volumes of waste into the environment. Abnormal leakage from dams is a threat to the integrity of the dam structure. Leakage and saturation in the dam body, which can lead to the collapse of the dam, increases the importance of leak detection. Geophysics has been used many times in environmental issues, especially in the study of mine tailings issues. Geophysical methods and its application were discussed. In this study, such problems are geoelectric methods are the most used methods. In these studies, in order to control the condition of the dam, two-dimensional special strength profiles were used along the dam crown or downstream of the embankment. The electrical resistivity method can detect leakage anomalies and measured resistivity can only be considered as a function of leakage current. Spontaneous potential helps to monitor the physical conditions and temporal changes in tailings dam conditions. Spontaneous potential method is a passive electrical method related to measuring the electrical potential distribution of a set of stations using non-polarized electrodes. This method involves passively measuring the distribution of electrical potential at the earth's surface or in boreholes, which, along with the polarization mechanism, conducts it to the earth. In this paper, the application of electrical resistivity tomography method and spontaneous potential in leak detection and mapping of the tailings dam (reservoir dam) of Miduk copper mine is discussed.
Geology and Geography:
Geographical and geological position of Miduk copper mine area is located 24 km northeast of Babak city and 314 km northwest of Sarcheshmeh copper mine at Kerman province of Iran. The region has a semi-desert and mountainous climate and a maximum altitude of 4824 meters above sea level. Miduk Copper Complex consists of mining units, condensing plant (refinery) and tailings dam (sediment dam and water intake dam). The tailings dam is located at a distance of 6 km from the condensing unit. The range containing the Miduk deposit is composed of Eocene volcanic and detrital igneous rocks by several intrusive masses. It is made of granodiorite, which sometimes extends more than 4 km. Infiltration masses and external igneous rocks are affected. Hydrothermal solutions are altered over a relatively wide range. Existence of alteration and consequent discoloration of andesites is the reason. Based on the performance of hydrothermal solutions and mineralization in the region. In the mineral zone, the surface cover of the zone is completely andesitic. Growth of granodiorite mass has caused andesite to rise. Veins of granodiorite are seen in some parts. In andesites, hydrothermal solutions and gases have caused condensation and as a result, a huge pressure has been created, which has caused the andesites to break, fragment and crack. Also, fractures caused due to high pressure of hydrothermal solutions and filled with silica, fluorine and metallic minerals such as pyrite.
Field Survey:
Electrical resistivity measurements were performed in two profiles of 288 and 388 meters. In the first profile, electrode distances of 48 m were considered for obtaining more depth information and in the second profile, electrode distances of 1 m were considered for better separation, but less depth information, downstream of the tailings dam (intake dam) of Miduk copper mine. Bipolar arrangement - Bipolar was used in these measurements and the data were collected with W-2 Series device with 1188 watt power and smart cable for semi-automatic harvesting. Figure (3) shows the position of the electrodes in each of the profiles taken.
Figure (1) Position of electrical resistivity profiles downstream of the tailings dam (intake dam): profiles (1 yellow dots) with an electrode distance of 20 m and profiles two (green dots) with an electrode distance of 5 m.
According to the Ohms Law , electric current (I) sent and the values of the potential difference (V) measured and the electrical resistance (R) was measured. Finally, the product of electrical resistance in the geometric factor of the arrangement k = 2π / (1 / AM,) 1 / AN-1 / BM + 1 / BN, the apparent specific electrical resistance () ρa (relation) was obtained.
R=∆V/I
ρa =Kr
The measured data were inversely modeled and interpreted by RES2DINV software. Figures (4) and (1) show the Pseudo-cross sections for each profile, drawn using the values obtained. According to the geology of the region, resistance values higher than 11 ohm meters have been attributed to alternate, semi-altered and fresh andesites. In some areas, the high resistance values are related to the hand-built structures in the area, including road infrastructure and concreting for the relevant facilities. Resistance below 31 ohm meters is probably due to the presence of a wet zone. As shown in Figure (4), the water has advanced to great depths. Therefore, the presence of surface water canal alone can not be the cause of wetting the area to a depth of more than 18 meters and there is a possibility of faults in the area. The possible position of the fault is shown in Figure (4). Figure (1) also shows values with resistivity less than 31 ohm meters at a depth of approximately 8 meters; This can be due to the presence of water or other factors.

Figure (1) Position of electrical resistivity profiles downstream of the tailings dam (intake dam): profiles (1 yellow dots) with an electrode distance of 20 m and profiles two (green dots) with an electrode distance of 5 m.
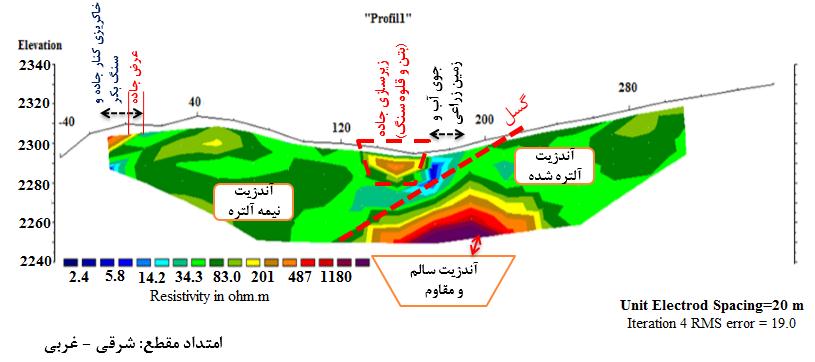
Figure (2) Pseudo-cross section of profile 1 electrical resistivity with electrode distance of 20 meters
Spontaneous potential and results :
Spontaneous potential measurements were performed using two Solid-polarizing electrodes of copper sulfate by observing a fixed electrode at the base station and a moving electrode, which is moved along the desired profile. In order ,to increase the quality of the data, the resistivity controls of the electrodes in contact with the ground and the electrode polarization control were performed. For this purpose, in order to determine the location of stations in each profile - which is 38 meters in each profile with electrode distances and the distance between the two profiles is 31 meters - a hole 48 to 18 cm deep was dug and some water was poured in each hole and left until harvest (34 hours later). The base station was located at a point outside the expected anomaly. The base station was read every 3 hours (after the end of each profile). The results show a positive anomaly of Spontaneous potential that is due to leakage. Figure 4(a and b) shows the map and curve of Spontaneous potential.

Figure (3) Pseudo-cross section of profile 2 electrical resistivity with electrode distance of 5 meter
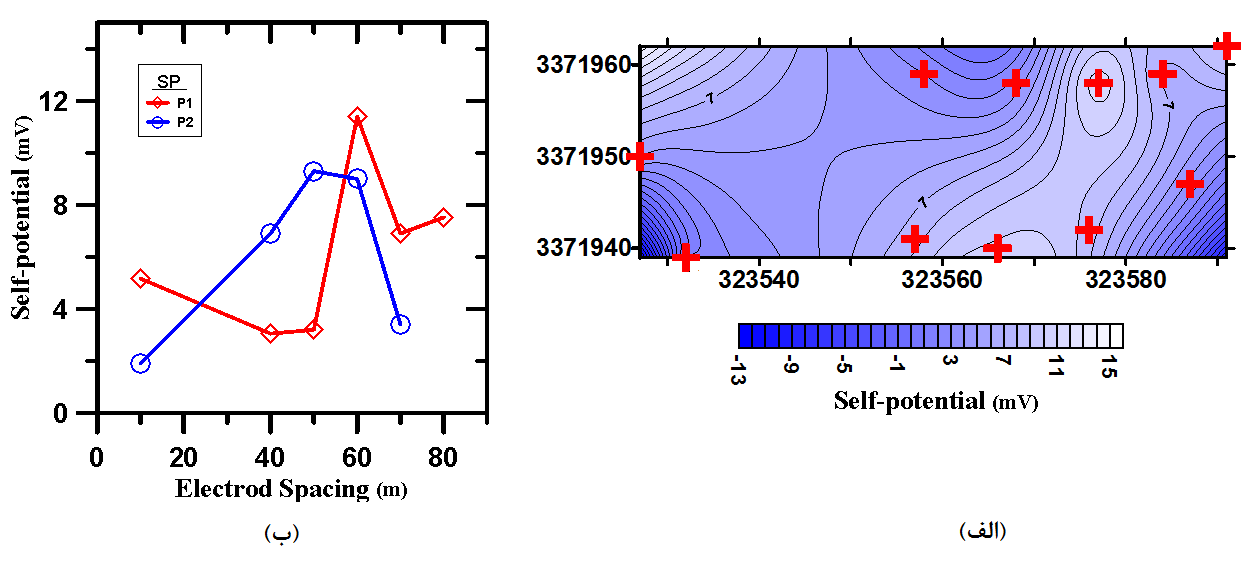
Figure 4 a) Spontaneous potential map - red dots show the location of the electrodes
4 b) Spontaneous potential curve
Conclusion :
In this paper, to determine the leakage from the tailings dam (reservoir dam) of Miduk copper mine, in the area, first two electrical resistivity profiles with a distance of 388 meters from each other and a bipolar-dipole arrangement at the bottom of the reservoir dam were taken. Profiles with a length of 288 m with electrode distances of 48 m and the second profile with a length of 388 m and electrode distances of 1 m were considered. Data measured with RES2DINV was modeled and interpreted inversely. The values of resistivity less than 31 ohm meters at a depth of approximately 8 meters in the second profile are probably due to leakage in the wall. In order to further investigate, due to the fact that the autogenous potential method with low penetration depth is used to determine the water path and leakage zones, two Spontaneous potential profiles were taken with two polarized electrodes of copper-copper sulfate. The positive anomaly resulting from the Spontaneous potential results shows good agreement with the results of the electrical resistivity profile and confirms the existence of water leakage at the northern support of the catchment dam.